Priced Out: How Did Housing Affordability Change Across U.S. States from 2019 to 2024?
Hello everyone and welcome back!
I hope you all had a wonderful fall break! For my fourth blog post, I decided to look at housing affordability. I became interested in this topic because discussions about housing often begin and end with home prices. However, the price itself does not tell me whether a home is actually affordable. I also want to know whether household incomes are keeping up and how much it now costs to finance a purchase.
This question also feels relevant to students and young workers. Current housing conditions affect where people can afford to live, how much they need to save, and whether moving for school or work is realistic. Looking across states can also show whether the national story applies everywhere or hides important regional differences.
My question is: how did housing affordability change across U.S. states from 2019 to 2024, and how much did higher mortgage rates add to the pressure?
Measuring Affordability
I use the U.S. Census Bureau’s 2019 and 2024 American Community Survey one-year estimates for median household income and the median value of owner-occupied housing units. I combine these data with the Freddie Mac 30-year fixed mortgage rate available through FRED.
First, I calculate the home-value-to-income ratio for state \(s\) in year \(t\):
\[ R_{s,t} = \frac{V_{s,t}}{Y_{s,t}}, \]
where \(V_{s,t}\) is median home value and \(Y_{s,t}\) is median household income. A higher ratio means that a typical owner-occupied home costs more relative to annual household income.
I also calculate the cumulative growth of home values and income from 2019 to 2024:
\[ g_{X,s} = \left( \frac{X_{s,2024}}{X_{s,2019}}-1 \right) \times 100. \]
For the last measure, I estimate a monthly mortgage payment using the same assumptions for every state: purchase at the median home value, a 20% down payment, and a 30-year fixed-rate mortgage. The payment is
\[ M_{s,t} = P_{s,t} \left[ \frac{r_t(1+r_t)^{360}} {(1+r_t)^{360}-1} \right], \]
where \(P_{s,t}\) is 80% of median home value and \(r_t\) is the monthly mortgage rate. I convert this payment into an annual share of median household income:
\[ B_{s,t} = \frac{12M_{s,t}}{Y_{s,t}} \times 100. \]
The complete data download, cleaning, calculations, and visualization code is available in my GitHub repository.
Affordability Worsened Almost Everywhere
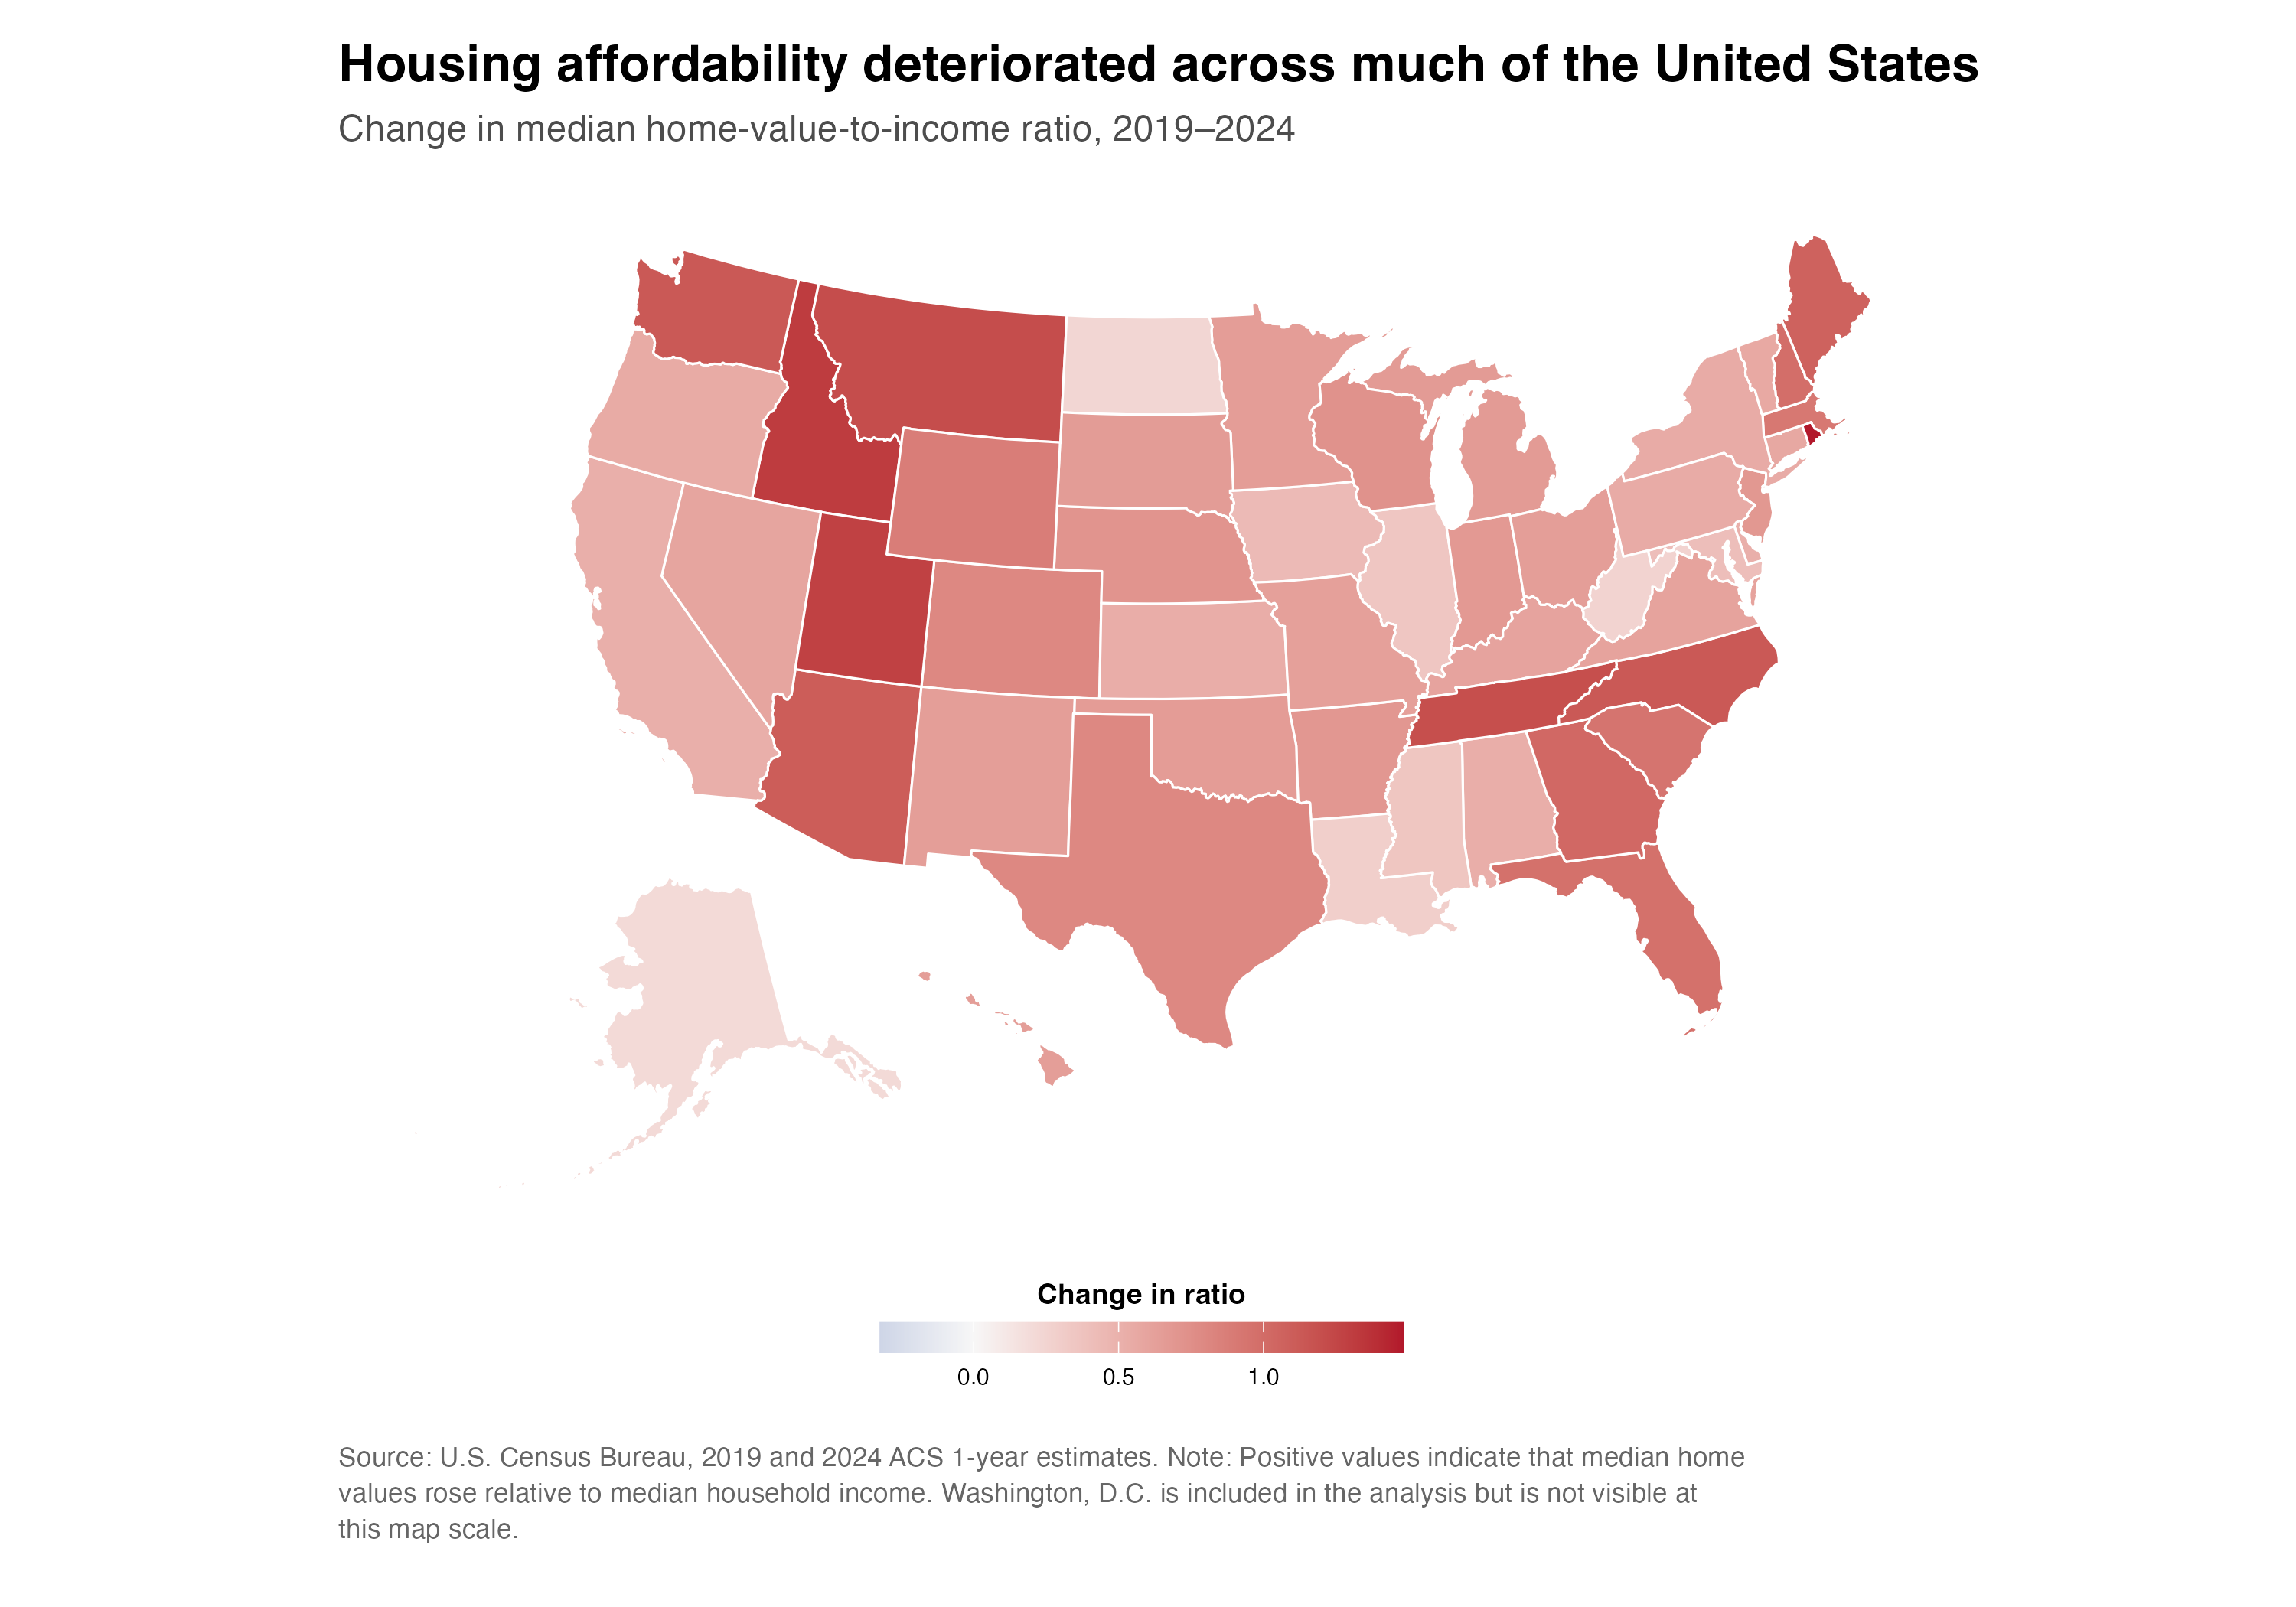
Figure 1 gives the broad picture. The home-value-to-income ratio increased in every state, while Washington, D.C. was the only exception. Across the 50 states and D.C., the median ratio rose from 3.42 in 2019 to 4.24 in 2024.
In other words, the median state moved from a typical owner-occupied home being worth about 3.4 years of median household income to more than 4.2 years. The pattern was also not limited to places already known for expensive housing. Several Mountain West and Southern states experienced some of the largest increases.
Home Values Moved Faster Than Income
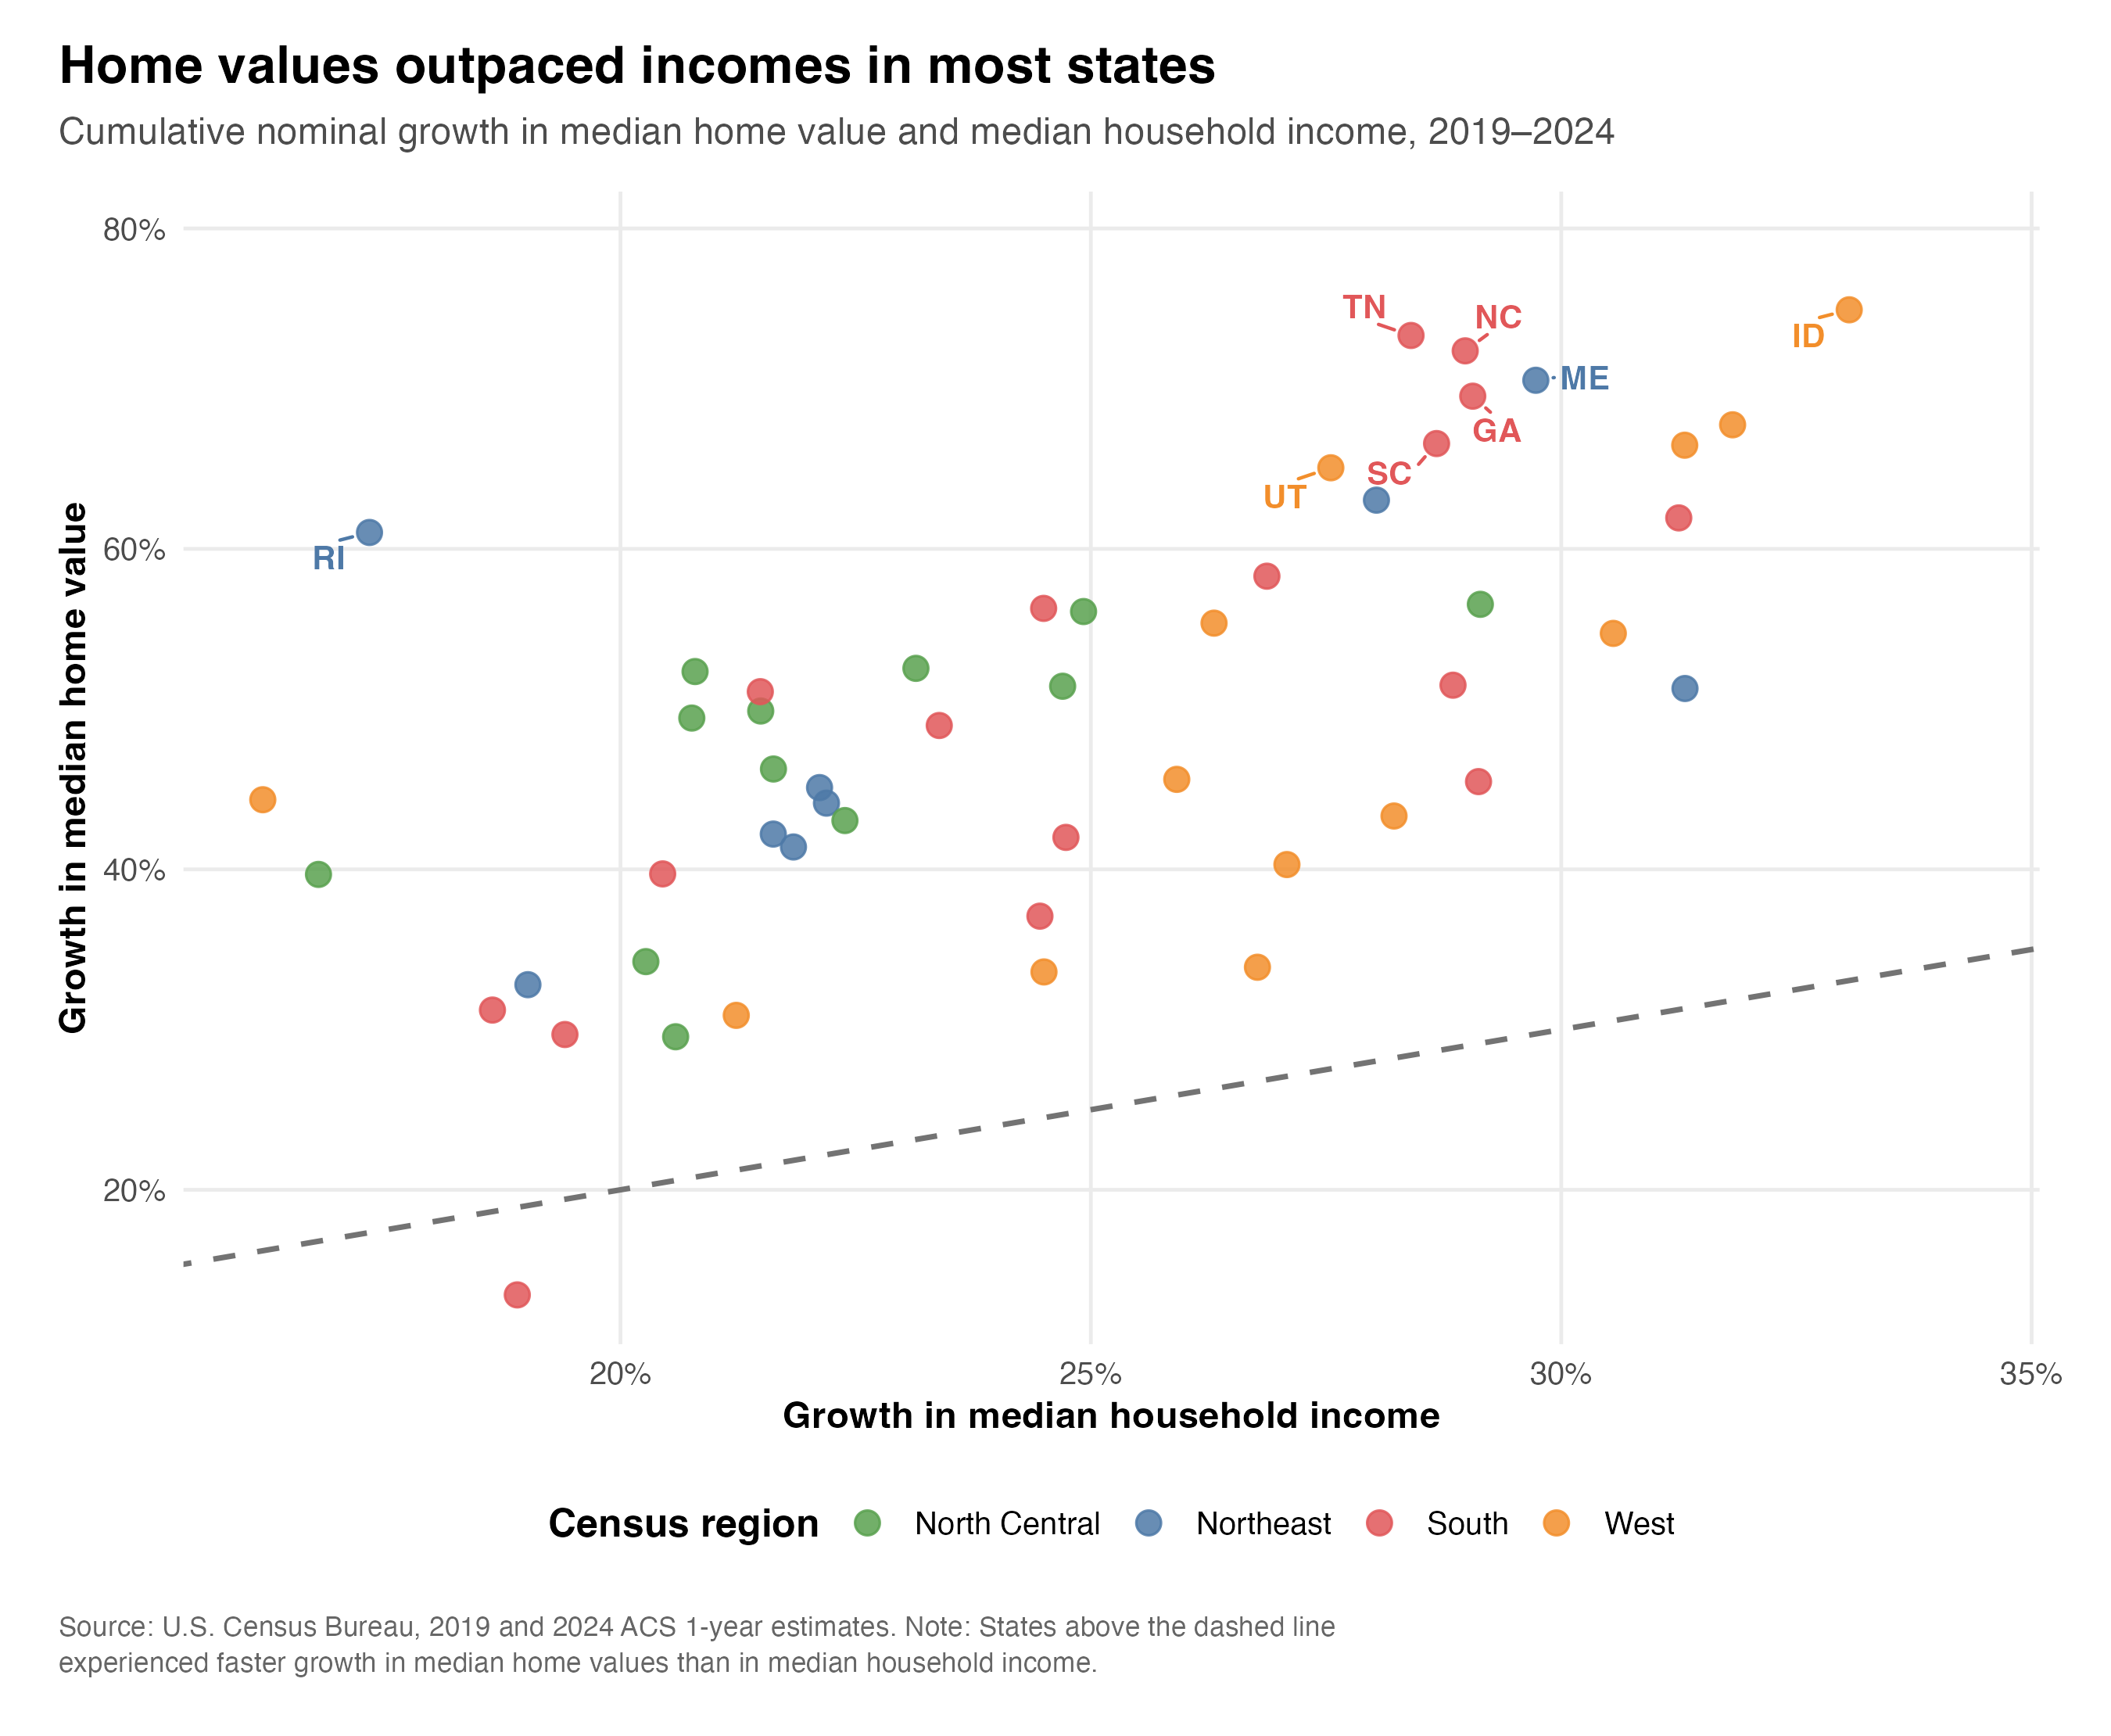
Figure 2 shows what is behind that pattern. The median state-level increase in home values was 49.4%, while the median increase in household income was 24.5%. Home values grew faster than income in every state; D.C. was again the only exception.
Rhode Island had the largest increase in its ratio, which rose from 3.98 to 5.46. Idaho, Utah, Montana, and Tennessee followed. This does not mean that these were the five most expensive housing markets in 2024. It means that their affordability measures deteriorated the most relative to where they started in 2019.
Mortgage Rates Added More Pressure
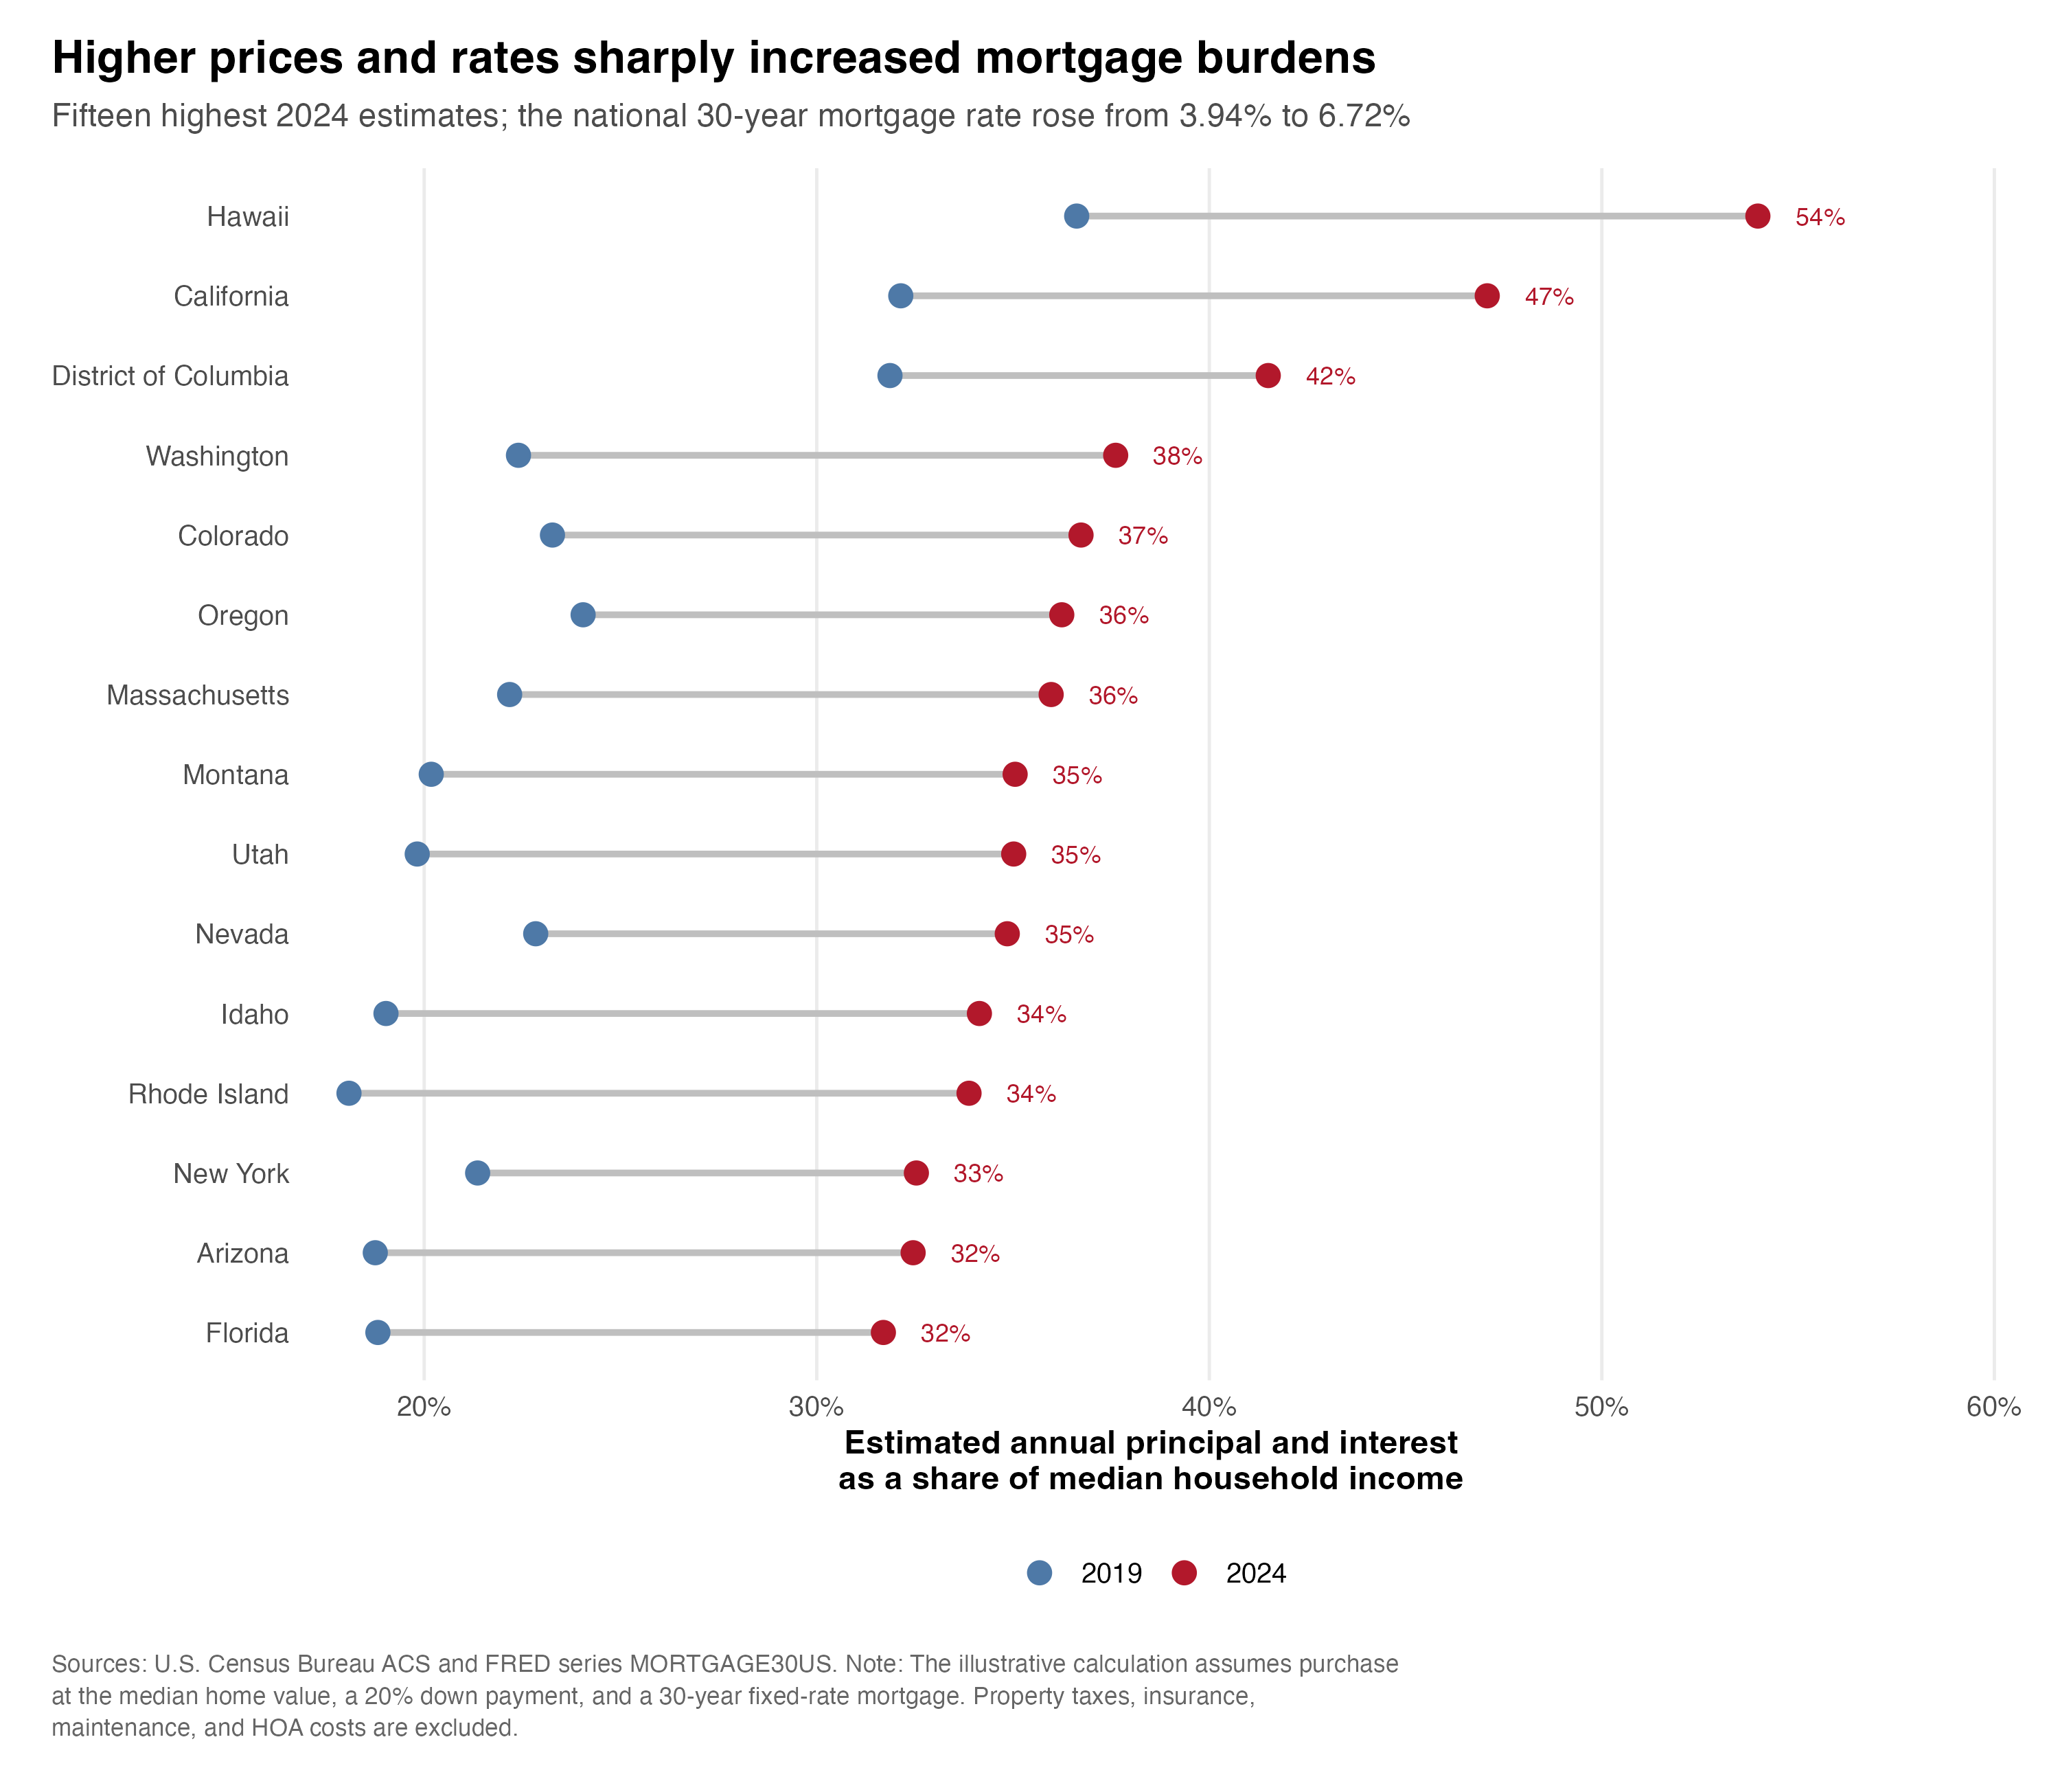
Figure 3 brings borrowing costs into the comparison. The annual average 30-year mortgage rate increased from 3.94% in 2019 to 6.72% in 2024. Using the same mortgage assumptions, the median estimated payment burden increased from 15.6% to 26.3% of median household income.
Hawaii had the highest 2024 estimate at 54.0%, followed by California at 47.1% and Washington, D.C. at 41.5%. These estimates are simplified. They exclude property taxes, insurance, maintenance, closing costs, and HOA fees. ACS home values are reported values for existing owner-occupied homes, while median household income includes both renters and homeowners. I therefore use this measure as a consistent comparison across states, not as the exact budget of a typical buyer.
This is a descriptive analysis. It shows where affordability changed, but it does not explain why one state experienced a larger change than another.
Takeaway
Generally speaking, this analysis gives me three main takeaways:
- The home-value-to-income ratio increased in every state between 2019 and 2024. Washington, D.C. was the only exception.
- Home values grew much faster than household incomes. The median state-level increases were 49.4% for home values and 24.5% for income.
- Higher borrowing costs made the change more difficult for potential buyers. The average mortgage rate rose from 3.94% to 6.72%, while the median estimated payment burden increased from 15.6% to 26.3% of household income.
For me, the most important point is that no single number fully explains housing affordability. Looking only at home values would miss the role of income, while looking only at mortgage rates would miss how much the value-to-income relationship had already changed. Both changes worked in the same direction, making a typical home substantially harder to buy across most of the country.